Global Carbon Budget 2021
(Cross-posted from Global Carbon Project, content shared by the Global Carbon Project, edited/formatted below by the U.S. Carbon Program Office)
HIGHLIGHTS
Index | Presentation | Publications | Press & News Media | Data | Infographics | Images | Visualisations
Key Messages: Global Carbon Budget 2021
The Global Carbon Project is an international research project within the Future Earth research initiative on global sustainability, and a research partner of the World Climate Research Programme. It aims to develop a complete picture of the global carbon cycle, including both its biophysical and human dimensions together with the interactions and feedbacks between them.
The Global Carbon Budget 2021 is the 16th edition of the annual update that started in 2006. These analyses are based on established methodologies but not yet peer-reviewed. Data and methods are detailed in the publications listed below:
This media release is part of the Global Carbon Budget 2021, the annual update by the Global Carbon Project. The Global Carbon Budget annual update builds on established methodologies in a fully transparent manner. The 2021 edition is published as a preprint and is undergoing an open review in the journal Earth System Science Data.
The Global Carbon Project is an international partner of the U.S. Carbon Cycle Science Program. Multiple U.S. based scientists funded by CCIWG agencies participate in the formulation of the annual Global Carbon Budgets. For this 2021 budget, the following U.S. contributors were involved: Rob B. Jackson, Simone R. Alin, Louise P. Chini, Richard A. Feely, Dennis Gilfillan, Richard A. Houghton, George C. Hurtt, Daniel Kennedy, Junjie Liu, Gregg Marland, David R. Munro, Denis Pierrot, Benjamin Poulter, Laure Resplandy, Adrienne J. Sutton, Colm Sweeney, Pieter P. Tans, Hanqin Tian and Rik Wanninkhof
Download 2021 Global Carbon Budget presentation version:1.0 (released 4 November 2021)
PowerPoint (12.9MB)
PDF(8.9MB)
View and download individual images and data, with selected country images
Headline results of the Global Carbon Budget 2021
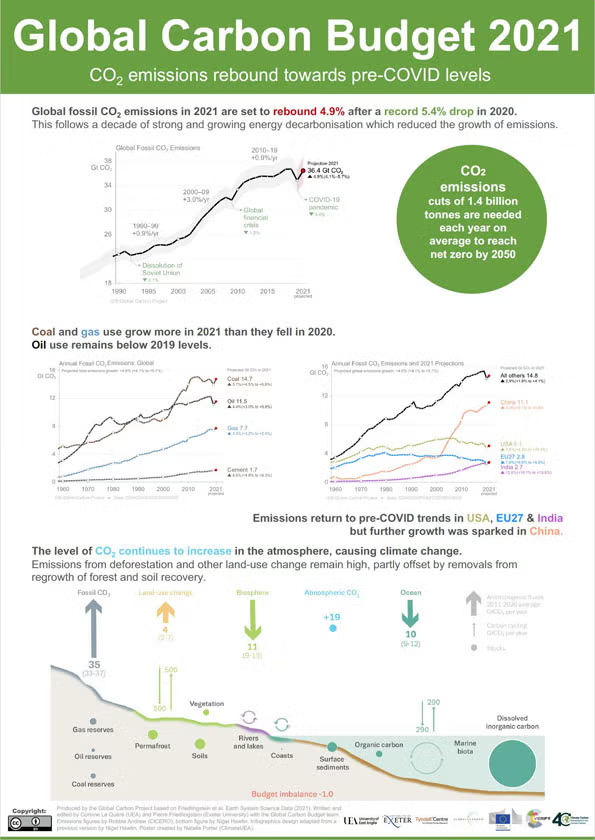
Global fossil CO2 emissions in 2021 are set to rebound close to their pre-COVID levels after an unprecedented drop in 2020. Emissions from coal and gas use are set to grow more in 2021 than they fell in 2020, but emissions from oil use remain below 2019 levels.
For major emitters, fossil CO2 emissions in 2021 appear to return to pre-COVID trends with a decreasing trend in CO2 emissions for the USA and European Union (EU27) and an increasing trend in CO2 emissions for India. For China, the response to the COVID-19 pandemic has sparked further growth in CO2 emissions, pushed by the power and industry sectors.
Decarbonisation1 of energy showed a strong and growing signal in the decade 2010-2019 at the global level, pushing CO2 emission down in the USA, EU27, and slowing their growth in China. Decarbonisation of energy was not enough to compensate for the growing energy demand still largely met by fossil energy sources in many countries, despite the high deployment rate of renewables, resulting in continued growth in global emissions albeit at a slower rate.
The rapid rebound in fossil CO2 emissions as economies recover from the COVID-19 pandemic reinforces the need for immediate action and global coherence in the world’s response to climate change.
Total CO2 emissions
Global fossil CO2 emissions in 2021 are returning towards their 2019 levels after an unprecedented drop in 2020.
2020 & 2021 figures. The record decrease in 2020 emissions was 1.9 billion tonnes of CO2(GtCO2) [−5.4%], from 36.7 GtCO2in 2019 to 34.8 GtCO2in 2020. Emissions are projected to grow 4.9% (4.1% to 5.7%) in 2021, to 36.4 GtCO2. Global emissions in 2021 remain about 0.8% below their level in 2019. The 2021 growth of 1.6 GtCO2is similar to the growth observed in 2010 following the global financial crisis of 2008-2009 (1.7 GtCO2; 5.5% above 2009 levels).
Analysis by fuel type. Emissions from coal use in 2021 are projected to be above their 2019 levels but still below their peak in 2014. Emissions from natural gas use are also expected to rise above 2019 levels in 2021, continuing a steady trend of rising gas use that dates back at least sixty years. Only CO2 emissions from oil remain well below 2019 levels in 2021.
Analysis by sector. At the global level for 2021, emissions from the power and industry sectors are estimated to be above 2019 levels based on indirect activity data2, while emissions in road transport and aviation appear still below their 2019 level. These sectoral changes compensate to give emissions in 2021 that are approaching their 2019 level.
Analysis by large country/region. The global growth in fossil CO2 emissions mainly arises from the growth in coal use in the power and industry sectors in China (see country details below). The projection for 2021 follows long-term background trends of increasing CO2 emissions for India and decreasing CO2 emissions for the USA and EU27. For China, the response to the COVID-19 pandemic appears to have sparked further growth in CO2 emissions. For the Rest of the World (in aggregate), the rebound is dampened and breaks with the recent growth in emissions.
Decarbonisation of energy showed a strong and growing signal in the decade 2010-2019 at the global level.
Fossil CO2 emissions significantly decreased in 23 countries3 whose economies grew significantly during the decade 2010-2019 prior to the COVID-19 pandemic. Altogether, these 23 countries contribute to 9.2 GtCO2 over the last decade, about one quarter of global fossil CO2emissions. Consumption-based emissions are also falling significantly in 15 of these countries (Belgium, Croatia, Czech Republic, Denmark, Finland, France, Germany, Israel, Japan, Mexico, Netherlands, Slovenia, Sweden, United Kingdom and the USA).
The emission declines in the USA and EU27 during 2010-2019 are primarily driven by increased decarbonisation (CO2 emissions per unit energy) compared to the previous decade. Increased decarbonisation also helped slow the growth in Chinese emissions during 2010-2019, but not in India or the rest of the world, where fossil CO2 emissions continue to grow to meet growing energy demand despite the high deployment of renewables in some countries.
The full effect of responses to the COVID-19 pandemic on CO2 emissions is still uncertain.
The economic disruption of COVID-19 in 2020 appears to have accelerated the transition to renewables, with renewables sustaining growth through 2020 while fossil fuels declined. Energy use from renewables increased 31.7 EJ in 2020, continuing the growth of >10% per year on average over the past 5 years, despite a substantial 25 EJ decline in global energy demand4.
The rebound in global fossil CO2 emissions in 2021 reflects a return towards the pre-COVID fossil-based economy. Investments in the green economy in the post-COVID recovery plans of some countries have been insufficient so far, on their own, to avoid a substantial return close to pre-COVID emissions.
A further rise in emissions in 2022 cannot be ruled out if the road transport and aviation sectors return to their pre-pandemic activity and emissions levels and coal use is stable. The course of CO2 emissions will be influenced by near-term economic incentives and climate policy.
The 2020-2021 emissions dip and recovery varied by country. The country/region figures exclude international transport, particularly aviation.
China. Emissions from China are projected to rise 4.0% in 2021, following a rise of 1.4% in 2020. Emissions in 2021 are set to be 5.5% above 2019, reaching 11.1 GtCO2, 31% of global emissions. Emissions from China have grown in both 2020 and in 2021 so far, driven by emissions in the power and industry sectors. These data suggest COVID-19 recovery incentives have sparked further growth in CO2 emissions in China, by boosting industrial production heavily reliant on coal.
USA. Emissions from the USA are projected to rise 7.6% in 2021 following a fall of 10.6% in 2020. Emissions in 2021 are set to remain 3.7% below 2019 levels, reaching 5.1 GtCO2, 14% of global emissions. Data from the US EIA and elsewhere2 suggest emissions from industry are back to 2019 levels, while emissions from all other sectors remain below.
EU27. Emissions from the EU27 are projected to rise 7.6% in 2021 following a fall of 10.9% in 2020. Emissions in 2021 are set to remain 4.2% below 2019 levels, reaching 2.8 GtCO2, 7% of global emissions.
India. Emissions from India are projected to rise 12.6% in 2021 following a fall of 7.3% in 2020. Emissions in 2021 are set to be 4.4% above 2019, reaching 2.7 GtCO2, 7% of global emissions).
Rest of the World (including all international transport). Emissions from the rest of the world are projected to rise 2.9% in 2021 following a fall of 7.0% in 2020. Emissions in 2021 are set to be 4.2% below 2019 levels, reaching 14.8 GtCO2in aggregate, 59% of global emissions. These emissions are kept well below the 2019 level mainly because of a dampened rebound in economic growth in these countries, and to a lesser extent because they include emissions from global international transport, particularly aviation.
CO2 emissions from land-use change5 show continuing high gross emissions and a recent decline in net fluxes, but with high uncertainties.
Estimates of gross and net fluxes converge based on revised data of land-use change5. Thisbrings several independent estimates closer together. However, the convergence of mean emission estimates does not capture the high uncertainty in land-use change datasets, which likely underestimate interannual variability and the (rising) importance of degradation. Without progress on accurate monitoring of land-use change, uncertainty in emission estimates, their trends and contributions to emissions reduction targets will remain high.
Global gross emissions due to land-use change5remain high at 14.1 GtCO2 over the past decade. Reduced monitoring capacities and legal enforcement of measures to reduce tropical deforestation in the wake of the pandemic have been observed in multiple countries and may impair emissions reductions.
Global gross removals have increased in the last two decades to 9.9 GtCO2 over the past decade. Gross removals occur because of the regrowth of forests and soil recovery after agricultural abandonment and wood harvesting.
The revised estimates of net land-use change emissions (the difference between gross emissions and gross removals) suggest a decline in emissions from 4.5 GtCO2 per year in the early 2000s (2000-2009) to 3.2 GtCO2in 2020, with a projection of 2.9 GtCO2in 2021. This trend remains to be confirmed.
Land CO2 emissions can be reduced by acting on both gross emissions and on gross removals, which are better monitored and understood. These two levers largely act on different regions of the globe, and operate in parallel.
For the first time, we link the global carbon budget models' estimates to the official country reporting of national greenhouse gases inventories. While the global carbon budget distinguishes anthropogenic from natural drivers of land carbon fluxes, country reporting is area-based and attributes part of the natural terrestrial sink on managed land to the land-use sector. Accounting for this redistribution, the two approaches are shown to be consistent with each other.
Total CO2 emissions from fossil and land-use change combined have remained relatively constant at 39.7 GtCO2 over the past decade with a rise in fossil CO2 emissions but a decline in the more uncertain revised land-use change CO2 emissions. Fossil fuel emissions are mainly from the Northern Hemisphere, while land-use change emissions are mainly from the tropics.
Continued emissions further reduced the remaining carbon budget to keep global warming below the limits set in the Paris Agreement. The remaining carbon budget for a 50% chance to limit global warming to 1.5°C, 1.7°C and 2°C has shrunk to 420 GtCO2, 770 GtCO2 and 1270 GtCO2respectively, equivalent to 11, 20 and 32 years at 2021 emissions levels, from the beginning of 2022.
Reaching net zero CO2 emissions by 2050 entails cutting total CO2 emissions by 1.4 GtCO2 each year on average, comparable to the 1.9 GtCO2 drop during 2020, highlighting the scale of the needed action.
Atmospheric CO2 accumulation and the natural carbon sinks
The level of CO2 continued to increase in the atmosphere in both 2020 and 2021 following long-term trends because of continued emissions.
Atmospheric CO2 concentration increased 2.4 parts per million in 2020 and is projected to increase by 2.0 parts per million in 2021 to reach 415 parts per million averaged over the year (see latest trends here)6. The atmospheric CO2 growth was 18.7 GtCO2(2.4 ppm) on average each year during the decade 2011-2020, indicating that 47% of total CO2 emissions remained in the atmosphere. The 2020 decrease in total CO2 emissions of about 2.5 GtCO2 propagated to an atmospheric CO2 growth, reduced by 1.4 GtCO2(0.18 ppm) relative to the 2019 growth rate. The 2021 growth rate is lower than in recent years due to La Niña conditions in 2021, a short-term natural climatic event that brings conditions favourable to an enhanced natural land carbon sink.
The land and ocean CO2 sinks combined continued to take up around half (53% over the past decade) of the CO2 emitted to the atmosphere. The natural carbon reservoirs, the ocean and the terrestrial biosphere, continue to take up CO2 as atmospheric levels grow. Increasing atmospheric CO2 drives the land and ocean sinks while climate change reduces the carbon sinks.
The ocean CO2 sink resumed a more rapid growth in the past decade after low or no growth during the 1991-2002 period. The growth of the ocean CO2 sink in the past decade has an uncertainty of a factor of three, mainly originating from the Southern Ocean. The ocean CO2 sink was 10.3 GtCO2 per year (26% of total CO2 emissions) during the decade 2011-2020 with a preliminary 2021 estimate of around 10.6 GtCO2.
The natural land CO2 sink continued to increase during the 2011-2020 period in response to increased atmospheric CO2, albeit with large interannual variability. The natural land CO2 sink was 11.4 GtCO2 per year on average during the 2011-2020 decade (28% of total CO2 emissions), 1.8 GtCO2 per year larger than during the previous decade (2000-2009), with a preliminary 2021 estimate of around 12.1 GtCO2 per year. Year to year variability in the natural land sink is about 4 GtCO2 yr-1, making smaller annual changes in anthropogenic emissions hard to detect in global atmospheric CO2 concentration.
Globally during the decade 2011-2020, climate change reduced the land sink by about 15% and the ocean sink by about 5%. The effect of climate change on the sinks cannot yet be detected in atmospheric CO2 observations because of the presence of large natural climate variability. It was estimated using an ensemble of models.
Footnotes
1 Decarbonisation is the shift from fossil fuels (coal, oil, gas) to renewables or from the most carbon intensive fossil fuels to less intensive fossil fuels (coal to gas).
2 Sectoral data are from carbonmonitor.org and refer to the period January-September.
3 Barbados, Belgium, Croatia, Czech Republic, Denmark, Finland, France, Germany, Israel, Japan, Luxembourg, North Macedonia, Malta, Mexico, Netherlands, Slovakia, Slovenia, Solomon Islands, Sweden, Switzerland, Tuvalu, United Kingdom and the USA. View all countries and different time-periods.
4 BP Statistical Review of World Energy June 2021
5 CO2 emissions from land-use change refer to emissions from land-use, land-use change and forestry, such as deforestation and wood harvest. They exclude CO2fluxes from vegetation in response to changing CO2 concentration and climate conditions.
----------
Table 1. 2020 fossil CO2 emissions from top 20 countries including the EU27 (together and separately) in billion tonnes CO2/yr, and projection of growth for 2021. IAS stands for International aviation and shipping. Growth rate in emissions can be explored for all countries and different periods using the embeddable visualisation
| 2020 emissions (billion tonnes | 2020 % of total | 2020 emissionsper capita (tonnes | 2020 growth | 2021 projected growth | |
| Country | CO2/yr) | (excl. IAS) | CO2/pers/yr) | (percent) | (percent) |
| China | 10.7 | 31% | 7.4 | 1.4% | 4.0%(2.1% to 5.8%) |
| USA | 4.7 | 14% | 14.2 | -10.6% | 7.6%(5.3% to 10%) |
| EU27 | 2.6 | 7.5% | 5.8 | -10.9% | 7.6%(5.6% to 10%) |
| India | 2.4 | 7.0% | 1.8 | -7.3% | 12.6%(10.7% to 13.6%) |
| Russia | 1.6 | 4.5% | 10.8 | -6.3% | |
| Japan | 1.0 | 3.0% | 8.1 | -7.1% | |
| Iran | 0.75 | 2.1% | 8.9 | 1.3% | |
| Germany | 0.64 | 1.9% | 7.7 | -9.7% | |
| Saudi Arabia | 0.63 | 1.8% | 18.0 | 0.2% | |
| South Korea | 0.60 | 1.7% | 11.7 | -8.0% | |
| Indonesia | 0.59 | 1.7% | 2.2 | -11.0% | |
| Canada | 0.54 | 1.5% | 14.2 | -8.2% | |
| Brazil | 0.47 | 1.3% | 2.2 | -4.1% | |
| South Africa | 0.45 | 1.3% | 7.6 | -5.3% | |
| Turkey | 0.39 | 1.1% | 4.7 | -1.9% | |
| Australia | 0.39 | 1.1% | 15.4 | -5.7% | |
| Mexico | 0.36 | 1.0% | 2.8 | -18.3% | |
| United Kingdom | 0.33 | 0.9% | 4.9 | -10.9% | |
| Italy | 0.30 | 0.9% | 5.0 | -10.8% | |
| Poland | 0.30 | 0.9% | 7.9 | -6.5% | |
| Kazakhstan | 0.29 | 0.8% | 15.5 | -1.8% | |
| World (incl. IAS) | 34.8 | 100% | 4.5 | -5.4% | 4.9%(4.1% to 5.7%) |
Contributors to Global Carbon Budget 2021
- Pierre Friedlingstein (College of Engineering, Mathematics and Physical Sciences, University of Exeter, Exeter EX4 4QF, UK and Laboratoire de Météorologie Dynamique/Institut Pierre-Simon Laplace, CNRS, Ecole Normale Supérieure/Université PSL, Sorbonne Université, Ecole Polytechnique, Paris, France)
- Matthew W. Jones (Tyndall Centre for Climate Change Research, School of Environmental Sciences, University of East Anglia, Norwich Research Park, Norwich NR4 7TJ, UK)
- Michael O'Sullivan (College of Engineering, Mathematics and Physical Sciences, University of Exeter, Exeter EX4 4QF, UK)
- Robbie M. Andrew (CICERO Center for International Climate Research, Oslo 0349, Norway)
- Dorothee C. E. Bakker (School of Environmental Sciences, University of East Anglia, Norwich Research Park, Norwich NR4 7TJ, UK)
- Judith Hauck (Alfred-Wegener-Institut, Helmholtz-Zentrum für Polar- und Meeresforschung, Am Handelshafen 12, 27570 Bremerhaven)
- Corinne Le Quéré (Tyndall Centre for Climate Change Research, School of Environmental Sciences, University of East Anglia, Norwich Research Park, Norwich NR4 7TJ, UK)
- Glen P. Peters (CICERO Center for International Climate Research, Oslo 0349, Norway)
- Wouter Peters (Wageningen University, Environmental Sciences Group, P.O. Box 47, 6700AA, Wageningen, The Netherlands and University of Groningen, Centre for Isotope Research, Groningen, The Netherlands)
- Julia Pongratz (Ludwig-Maximilians-Universität München, Luisenstr. 37, 80333 München, Germany and Max Planck Institute for Meteorology, Bundesstr. 53, 20146 Hamburg, Germany)
- Stephen Sitch (College of Life and Environmental Sciences, University of Exeter, Exeter EX4 4RJ, UK)
- Josep G. Canadell (CSIRO Oceans and Atmosphere, Canberra, ACT 2601, Australia)
- Philippe Ciais (Laboratoire des Sciences du Climat et de l'Environnement, LSCE/IPSL, CEA-CNRS-UVSQ, Université Paris-Saclay, F-91198 Gif-sur-Yvette, France)
- Rob B. Jackson (Department of Earth System Science, Woods Institute for the Environment, and Precourt Institute for Energy, Stanford University, Stanford, CA 94305–2210, United States of America)
- Simone R. Alin (National Oceanic & Atmospheric Administration, Pacific Marine Environmental Laboratory (NOAA/PMEL), 7600 Sand Point Way NE, Seattle, WA 98115, USA)
- Peter Anthoni (Karlsruhe Institute of Technology, Institute of Meteorology and Climate Research/Atmospheric Environmental Research, 82467 Garmisch-Partenkirchen, Germany)
- Nicholas R. Bates (Bermuda Institute of Ocean Sciences (BIOS), 17 Biological Lane, Ferry Reach, St. Georges, GEO1, Bermuda)
- Meike Becker (Geophysical Institute, University of Bergen, Bergen, Norway and Bjerknes Centre for Climate Research, Bergen, Norway)
- Nicolas Bellouin (Department of Meteorology, University of Reading, Reading, UK)
- Laurent Bopp (Laboratoire de Météorologie Dynamique/Institut Pierre-Simon Laplace, CNRS, Ecole Normale Supérieure/Université PSL, Sorbonne Université, Ecole Polytechnique, Paris, France)
- Thi T. T. Chau (Laboratoire des Sciences du Climat et de l'Environnement, LSCE/IPSL, CEA-CNRS-UVSQ, Université Paris-Saclay, F-91198 Gif-sur-Yvette, France)
- Frédéric Chevallier (Laboratoire des Sciences du Climat et de l'Environnement, LSCE/IPSL, CEA-CNRS-UVSQ, Université Paris-Saclay, F-91198 Gif-sur-Yvette, France)
- Louise P. Chini (Department of Geographical Sciences, University of Maryland, College Park, Maryland 20742, USA)
- Margot Cronin (Marine Institute Ireland, Galway, Rinville, Ireland)
- Kim I. Currie (NIWA, Union Place West, Dunedin, New Zealand)
- Bertrand Decharme (CNRM, Université de Toulouse, Météo-France, CNRS, Toulouse, France)
- Laique Djeutchouang (Department of Oceanography, University of Cape Town, Cape Town, 7701, South Africa and SOCCO, Council for Scientific and Industrial Research, Cape Town, 7700, South Africa)
- Xinyu Dou (Department of Earth System Science, Tsinghua University, Beijing, China)
- Wiley Evans (Hakai Institute, Heriot Bay, BC, Canada)
- Richard A. Feely (National Oceanic & Atmospheric Administration, Pacific Marine Environmental Laboratory (NOAA/PMEL), 7600 Sand Point Way NE, Seattle, WA 98115, USA)
- Liang Feng (National Centre for Earth Observation, University of Edinburgh, UK)
- Thomas Gasser (International Institute for Applied Systems Analysis (IIASA), Schlossplatz 1 A-2361 Laxenburg, Austria)
- Dennis Gilfillan (North Carolina School for Science and Mathematics, Durham, North Carolina, USA)
- Thanos Gkritzalis (Flanders Marine Institute (VLIZ), InnovOceanSite, Wandelaarkaai 7, 8400 Ostend, Belgium)
- Giacomo Grassi (European Commission, Joint Research Centre, 21027 Ispra (VA), Italy)
- Luke Gregor (Environmental Physics Group, ETH Zürich, Institute of Biogeochemistry and Pollutant Dynamics and Center for Climate Systems Modeling (C2SM), 8092 Zurich, Switzerland)
- Nicolas Gruber (Environmental Physics Group, ETH Zürich, Institute of Biogeochemistry and Pollutant Dynamics and Center for Climate Systems Modeling (C2SM), 8092 Zurich, Switzerland)
- Özgür Gürses (Alfred-Wegener-Institut, Helmholtz-Zentrum für Polar- und Meeresforschung, Am Handelshafen 12, 27570 Bremerhaven)
- Ian Harris (NCAS-Climate, Climatic Research Unit, School of Environmental Sciences, University of East Anglia, Norwich Research Park, Norwich, NR4 7TJ, UK)
- Richard A. Houghton (Woodwell Climate Research Center, Falmouth, MA 02540, USA)
- George C. Hurtt (Department of Geographical Sciences, University of Maryland, College Park, Maryland 20742, USA)
- Yosuke Iida (Atmosphere and Ocean Department, Japan Meteorological Agency, Minato-Ku, Tokyo 105-8431, Japan)
- Tatiana Ilyina (Max Planck Institute for Meteorology, Bundesstr. 53, 20146 Hamburg, Germany)
- Ingrid T. Luijkx (Wageningen University, Environmental Sciences Group, P.O. Box 47, 6700AA, Wageningen, The Netherlands)
- Atul K. Jain (Department of Atmospheric Sciences, University of Illinois, Urbana, IL 61821, USA)
- Steve D. Jones (Geophysical Institute, University of Bergen, Bergen, Norway and Bjerknes Centre for Climate Research, Bergen, Norway)
- Etsushi Kato (Institute of Applied Energy (IAE), Minato-ku, Tokyo 105-0003, Japan)
- Daniel Kennedy (National Center for Atmospheric Research, Climate and Global Dynamics, Terrestrial Sciences Section, Boulder, CO 80305, USA)
- Kees Klein Goldewijk (Utrecht University, Faculty of Geosciences, Department IMEW, Copernicus Institute of Sustainable Development, Heidelberglaan 2, P.O. Box 80115, 3508 TC, Utrecht, the Netherlands)
- Jürgen Knauer (CSIRO Oceans and Atmosphere, Canberra, ACT 2101, Australia and Hawkesbury Institute for the Environment, Western Sydney University, Penrith, New South Wales, Australia)
- Jan Ivar Korsbakken (CICERO Center for International Climate Research, Oslo 0349, Norway)
- Arne Körtzinger (GEOMAR Helmholtz Centre for Ocean Research Kiel, Düsternbrooker Weg 20, 24105 Kiel, Germany)
- Peter Landschützer (Max Planck Institute for Meteorology, Bundesstr. 53, 20146 Hamburg, Germany)
- Siv K. Lauvset (Bjerknes Centre for Climate Research, Bergen, Norway and NORCE Norwegian Research Centre, Jahnebakken 5, 5007 Bergen, Norway)
- Nathalie Lefèvre (LOCEAN/IPSL laboratory, Sorbonne Université, CNRS/IRD/MNHN, Paris, France)
- Sebastian Lienert (Climate and Environmental Physics, Physics Institute and Oeschger Centre for Climate Change Research, University of Bern, Bern, Switzerland)
- Junjie Liu (Jet Propulsion Laboratory, California Institute of Technology, Pasadena, CA, USA)
- Gregg Marland (Research Institute for Environment, Energy, and Economics, Appalachian State University, Boone, North Carolina, USA and Department of Geological and Environmental Sciences, Appalachian State University, Boone, North Carolina, USA)
- Patrick C. McGuire (Department of Meteorology, Department of Geography & Environmental Science, National Centre for Atmospheric Science, University of Reading, Reading, UK)
- Joe R. Melton (Climate Research Division, Environment and Climate Change Canada, Victoria, BC, Canada)
- David R. Munro (Cooperative Institute for Research in Environmental Sciences, University of Colorado, Boulder, CO, 80305, USA and National Oceanic & Atmospheric Administration/Global Monitoring Laboratory (NOAA/GML), Boulder, CO, 80305, USA)
- Julia E. M. S. Nabel (Max Planck Institute for Meteorology, Bundesstr. 53, 20146 Hamburg, Germany and Max Planck Institute for Biogeochemistry, Jena, Germany)
- Shin-Ichiro Nakaoka (Earth System Division, National Institute for Environmental Studies, 16-2 Onogawa, Tsukuba, Ibaraki, 305-8506 Japan)
- Yosuke Niwa (Earth System Division, National Institute for Environmental Studies, 16-2 Onogawa, Tsukuba, Ibaraki, 305-8506 Japan and Meteorological Research Institute, 1-1 Nagamine, Tsukuba, Ibaraki, 305-0052 Japan)
- Tsuneo Ono (Japan Fisheries Research and Education Agency, 2-12-4 Fukuura, Kanazawa-Ku, Yokohama 236-8648, Japan)
- Denis Pierrot (National Oceanic & Atmospheric Administration/Atlantic Oceanographic & Meteorological Laboratory (NOAA/AOML), Miami, FL 33149, USA)
- Benjamin Poulter (NASA Goddard Space Flight Center, Biospheric Sciences Laboratory, Greenbelt, Maryland 20771, USA)
- Gregor Rehder (Leibniz Institute for Baltic Sea Research Warnemuende (IOW), Seestrasse 15; 18119 Rostock, Germany)
- Laure Resplandy (Princeton University, Department of Geosciences and Princeton Environmental Institute, Princeton, NJ, USA)
- Eddy Robertson (Met Office Hadley Centre, FitzRoy Road, Exeter EX1 3PB, UK)
- Christian Rödenbeck (Max Planck Institute for Biogeochemistry, Jena, Germany)
- Thais M. Rosan (College of Life and Environmental Sciences, University of Exeter, Exeter EX4 4RJ, UK)
- Jörg Schwinger (Bjerknes Centre for Climate Research, Bergen, Norway and NORCE Norwegian Research Centre, Jahnebakken 5, 5007 Bergen, Norway)
- Clemens Schwingshackl (Ludwig-Maximilians-Universität München, Luisenstr. 37, 80333 München, Germany)
- Roland Séférian (CNRM, Université de Toulouse, Météo-France, CNRS, Toulouse, France)
- Adrienne J. Sutton (National Oceanic & Atmospheric Administration, Pacific Marine Environmental Laboratory (NOAA/PMEL), 7600 Sand Point Way NE, Seattle, WA 98115, USA)
- Colm Sweeney (National Oceanic & Atmospheric Administration/Global Monitoring Laboratory (NOAA/GML), Boulder, CO, 80305, USA)
- Toste Tanhua (GEOMAR Helmholtz Centre for Ocean Research Kiel, Düsternbrooker Weg 20, 24105 Kiel, Germany)
- Pieter P. Tans (National Oceanic and Atmospheric Administration, Earth System Research Laboratory (NOAA ESRL),Boulder, CO 80305, USA)
- Hanqin Tian (School of Forestry and Wildlife Sciences, Auburn University, 602 Ducan Drive, Auburn, AL 36849, USA)
- Bronte Tilbrook (CSIRO Oceans and Atmosphere, PO Box 1538, Hobart Tasmania 7001, Australia and Australian Antarctic Partnership Program, University of Tasmania, Hobart, Australia)
- Francesco Tubiello (Statistics Division, Food and Agriculture Organization of the United Nations, Via Terme di Caracalla, Rome 00153, Italy)
- Guido van der Werf (Faculty of Earth and Life Sciences, VU University, Amsterdam, The Netherlands)
- Nicolas Vuichard (Laboratoire des Sciences du Climat et de l'Environnement, LSCE/IPSL, CEA-CNRS-UVSQ, Université Paris-Saclay, F-91198 Gif-sur-Yvette, France)
- Chisato Wada (Earth System Division, National Institute for Environmental Studies, 16-2 Onogawa, Tsukuba, Ibaraki, 305-8506 Japan)
- Rik Wanninkhof (National Oceanic & Atmospheric Administration/Atlantic Oceanographic & Meteorological Laboratory (NOAA/AOML), Miami, FL 33149, USA)
- Andrew Watson (College of Life and Environmental Sciences, University of Exeter, Exeter EX4 4RJ, UK)
- David Willis (Tyndall Centre for Climate Change Research, School of Environmental Sciences, University of East Anglia, Norwich Research Park, Norwich NR4 7TJ, UK)
- Andrew J. Wiltshire (Met Office Hadley Centre, FitzRoy Road, Exeter EX1 3PB, UK)
- Wenping Yuan (School of Atmospheric Sciences, Sun Yat-sen University, Zhuhai, Guangdong 510245, China)
- Chao Yue (Laboratoire des Sciences du Climat et de l'Environnement, LSCE/IPSL, CEA-CNRS-UVSQ, Université Paris-Saclay, F-91198 Gif-sur-Yvette, France)
- Xu Yue (School of Environmental Science and Engineering, Nanjing University of Information Science and Technology (NUIST))
- Sönke Zaehle (Max Planck Institute for Biogeochemistry, Jena, Germany)
- Jiye Zeng (Earth System Division, National Institute for Environmental Studies, 16-2 Onogawa, Tsukuba, Ibaraki, 305-8506 Japan)
The primary reference for Carbon Budget 2021
Global Carbon Budget 2021, by Pierre Friedlingstein, Matthew W. Jones, Michael O'Sullivan, Robbie M. Andrew, Dorothee C. E. Bakker, Judith Hauck, Corinne Le Quéré, Glen P. Peters, Wouter Peters, Julia Pongratz, Stephen Sitch, Josep G. Canadell, Philippe Ciais, Rob B. Jackson, Simone R. Alin, Peter Anthoni, Nicholas R. Bates, Meike Becker, Nicolas Bellouin, Laurent Bopp, Thi T. T. Chau, Frédéric Chevallier, Louise P. Chini, Margot Cronin, Kim I. Currie, Bertrand Decharme, Laique Djeutchouang, Xinyu Dou, Wiley Evans, Richard A. Feely, Liang Feng, Thomas Gasser, Dennis Gilfillan, Thanos Gkritzalis, Giacomo Grassi, Luke Gregor, Nicolas Gruber, Özgür Gürses, Ian Harris, Richard A. Houghton, George C. Hurtt, Yosuke Iida, Tatiana Ilyina, Ingrid T. Luijkx, Atul K. Jain, Steve D. Jones, Etsushi Kato, Daniel Kennedy, Kees Klein Goldewijk, Jürgen Knauer, Jan Ivar Korsbakken, Arne Körtzinger, Peter Landschützer, Siv K. Lauvset, Nathalie Lefèvre, Sebastian Lienert, Junjie Liu, Gregg Marland, Patrick C. McGuire, Joe R. Melton, David R. Munro, Julia E. M. S. Nabel, Shin-Ichiro Nakaoka, Yosuke Niwa, Tsuneo Ono, Denis Pierrot, Benjamin Poulter, Gregor Rehder, Laure Resplandy, Eddy Robertson, Christian Rödenbeck, Thais M. Rosan, Jörg Schwinger, Clemens Schwingshackl, Roland Séférian, Adrienne J. Sutton, Colm Sweeney, Toste Tanhua, Pieter P. Tans, Hanqin Tian, Bronte Tilbrook, Francesco Tubiello, Guido van der Werf, Nicolas Vuichard, Chisato Wada, Rik Wanninkhof, Andrew Watson, David Willis, Andrew J. Wiltshire, Wenping Yuan, Chao Yue, Xu Yue, Sönke Zaehle, and Jiye Zeng (2021), Earth System Science Data, DOI: 10.5194/essd-2021-386. Please note, publication is in pre-print.
Also, see related budgets and assessment:
Regional Cabon Cycle Assessment and Processes (RECCAP2)