CO2 emissions Mapping for entire Los Angeles Megacity to help improve environmental policymaking
(Shared by U.S. Carbon Cycle Science Program community scientist Dr. Kevin Gurney.)
As the threat of global warming grows—and with it, the specter of more extreme conditions such as wildfires, droughts and tropical storms—cities across the U.S. are developing policies to reduce their emissions of greenhouse gases, chiefly carbon dioxide (CO2). Even though many local governments are committed to these goals, however, the emissions data they have to work with is often too general to provide a useful baseline and target the most effective policy.
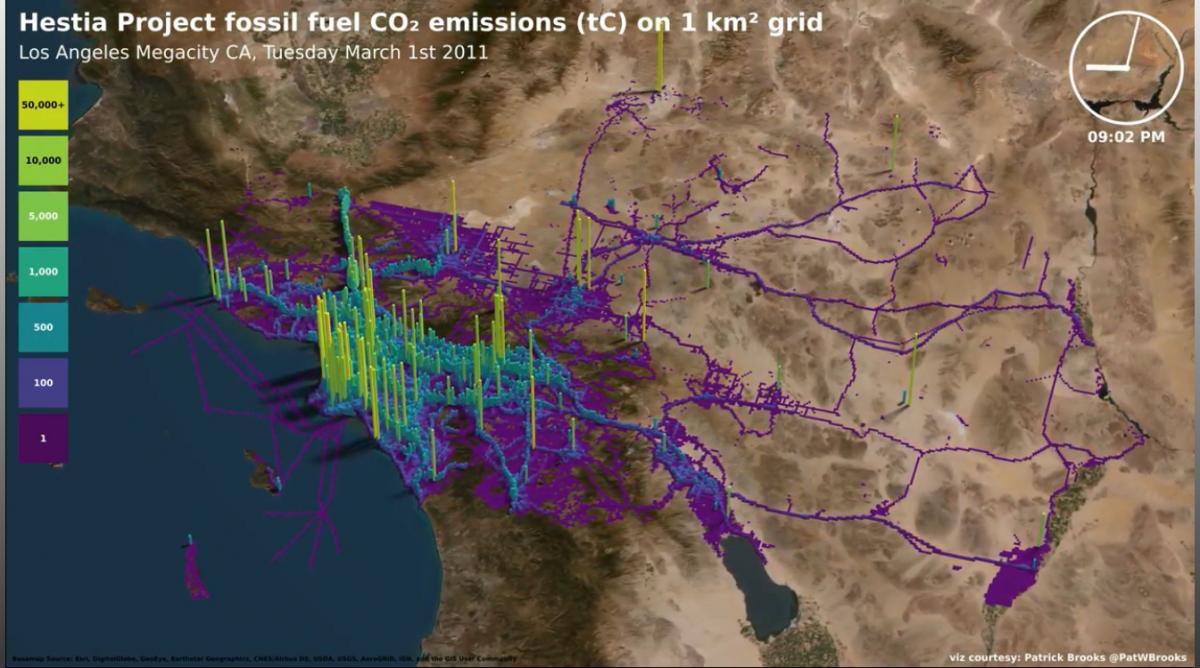
Professor Kevin Gurney of Northern Arizona University (NAU)’s School of Informatics, Computing and Cyber Systems today published results in Earth Systems Science Data [https://doi.org/10.5194/essd-11-1309-2019] detailing greenhouse gas emissions in the Los Angeles Megacity—the third largest metropolitan area in the world—occupying 4,850 square miles and housing more than 18.5 million people. In collaboration with scientists at Arizona State University, the University of Michigan, the National Institute of Standards and Technology (NIST) and NASA’s Jet Propulsion Laboratory, Gurney developed the high-resolution, bottom-up emissions map that includes every building and road in the Megacity—for a staggering emissions total of 176 million tons of CO2 per year. An animation of the LA Megacity results is available [http://hestia.rc.nau.edu/Visualization.html].
Gurney, who specializes in atmospheric science, ecology and public policy, has spent the past several years developing a standardized system, as part of the Hestia Project, that quantifies and visualizes greenhouse gases emitted in urban regions down to each street and building, identifying problem areas and showing where public policy is—or is not—making a difference. His goal is to provide cities with a means to strategically address problem areas instead of taking a sweeping and costly approach.
“We’re providing city stakeholders with a scalpel instead of a hammer. For example, about 60 percent of roadway emissions come from 10 percent of the roads. With Hestia, I can tell them which roads those are, and they can develop specific policy to address just those roads,” Gurney said. “The same is true for buildings. We can identify the ones with the highest emissions and track how well efforts to reduce those emissions are working. Policymakers can see progress.”
LA first megacity mapped in long-term project
Mapping Los Angeles was the latest effort in a long-term project that involves collaborators at NASA, the National Oceanic and Atmospheric Administration (NOAA), NIST, the University of Colorado, Pennsylvania State University, the Scripps Institution of Oceanography at the University of California, San Diego, the University of Utah, GNS Science in New Zealand and Purdue University. Other cities Gurney has mapped to this degree are Indianapolis, Salt Lake City and Baltimore. However, Gurney expects the Los Angeles mapping to have the most significant implications, especially considering the sheer size and scope of the area.
“It’s the first megacity for which we’ve quantified emissions down to the scale of every building and roadway. Nothing has been left out of an area that includes 80 cities and five counties,” Gurney said. “California has an aggressive policy when it comes to carbon dioxide emissions, and people want to know what the best policy options are and whether those policies are working. We can provide the information to local governments and they can take immediate action. And if we can do this for the entire Los Angeles Megacity, we can do it anywhere in the United States.”
One of the strengths of the approach is the incorporation of atmospheric monitoring of CO2 from ground-based and satellite instruments.
“By synthesizing the detail of building and road-scale emissions with the independence and accuracy of atmospheric monitoring,” Gurney said, “we have the best possible estimate of emissions with the most policy-relevant detail.”
Animated graphics help people visualize their city and their personal emissions to illustrate how their actions are affecting the environment they live in. Gurney hopes that will inspire people to become more engaged in policy development.
“When people see emissions from everyday activities mapped within the context of their block, neighborhood or city, they are more likely to become involved in the solution process,” Gurney said.
Data from the LA Megacity mapping project is available on the NIST website.
Gurney joined NAU in 2018, where he is continuing the research he started while at Arizona State University and prior to that at Purdue University. He has been involved with the United Nations Climate Change Framework Convention and the Kyoto Protocol for 25 years. In addition to his interests in carbon cycle science and policy, he has worked on stratospheric ozone depletion, radionuclide dose assessment and energy systems and climate-economic modeling.
—Kerry Bennett and Amy K. Phillips, Office of the Vice President for Research